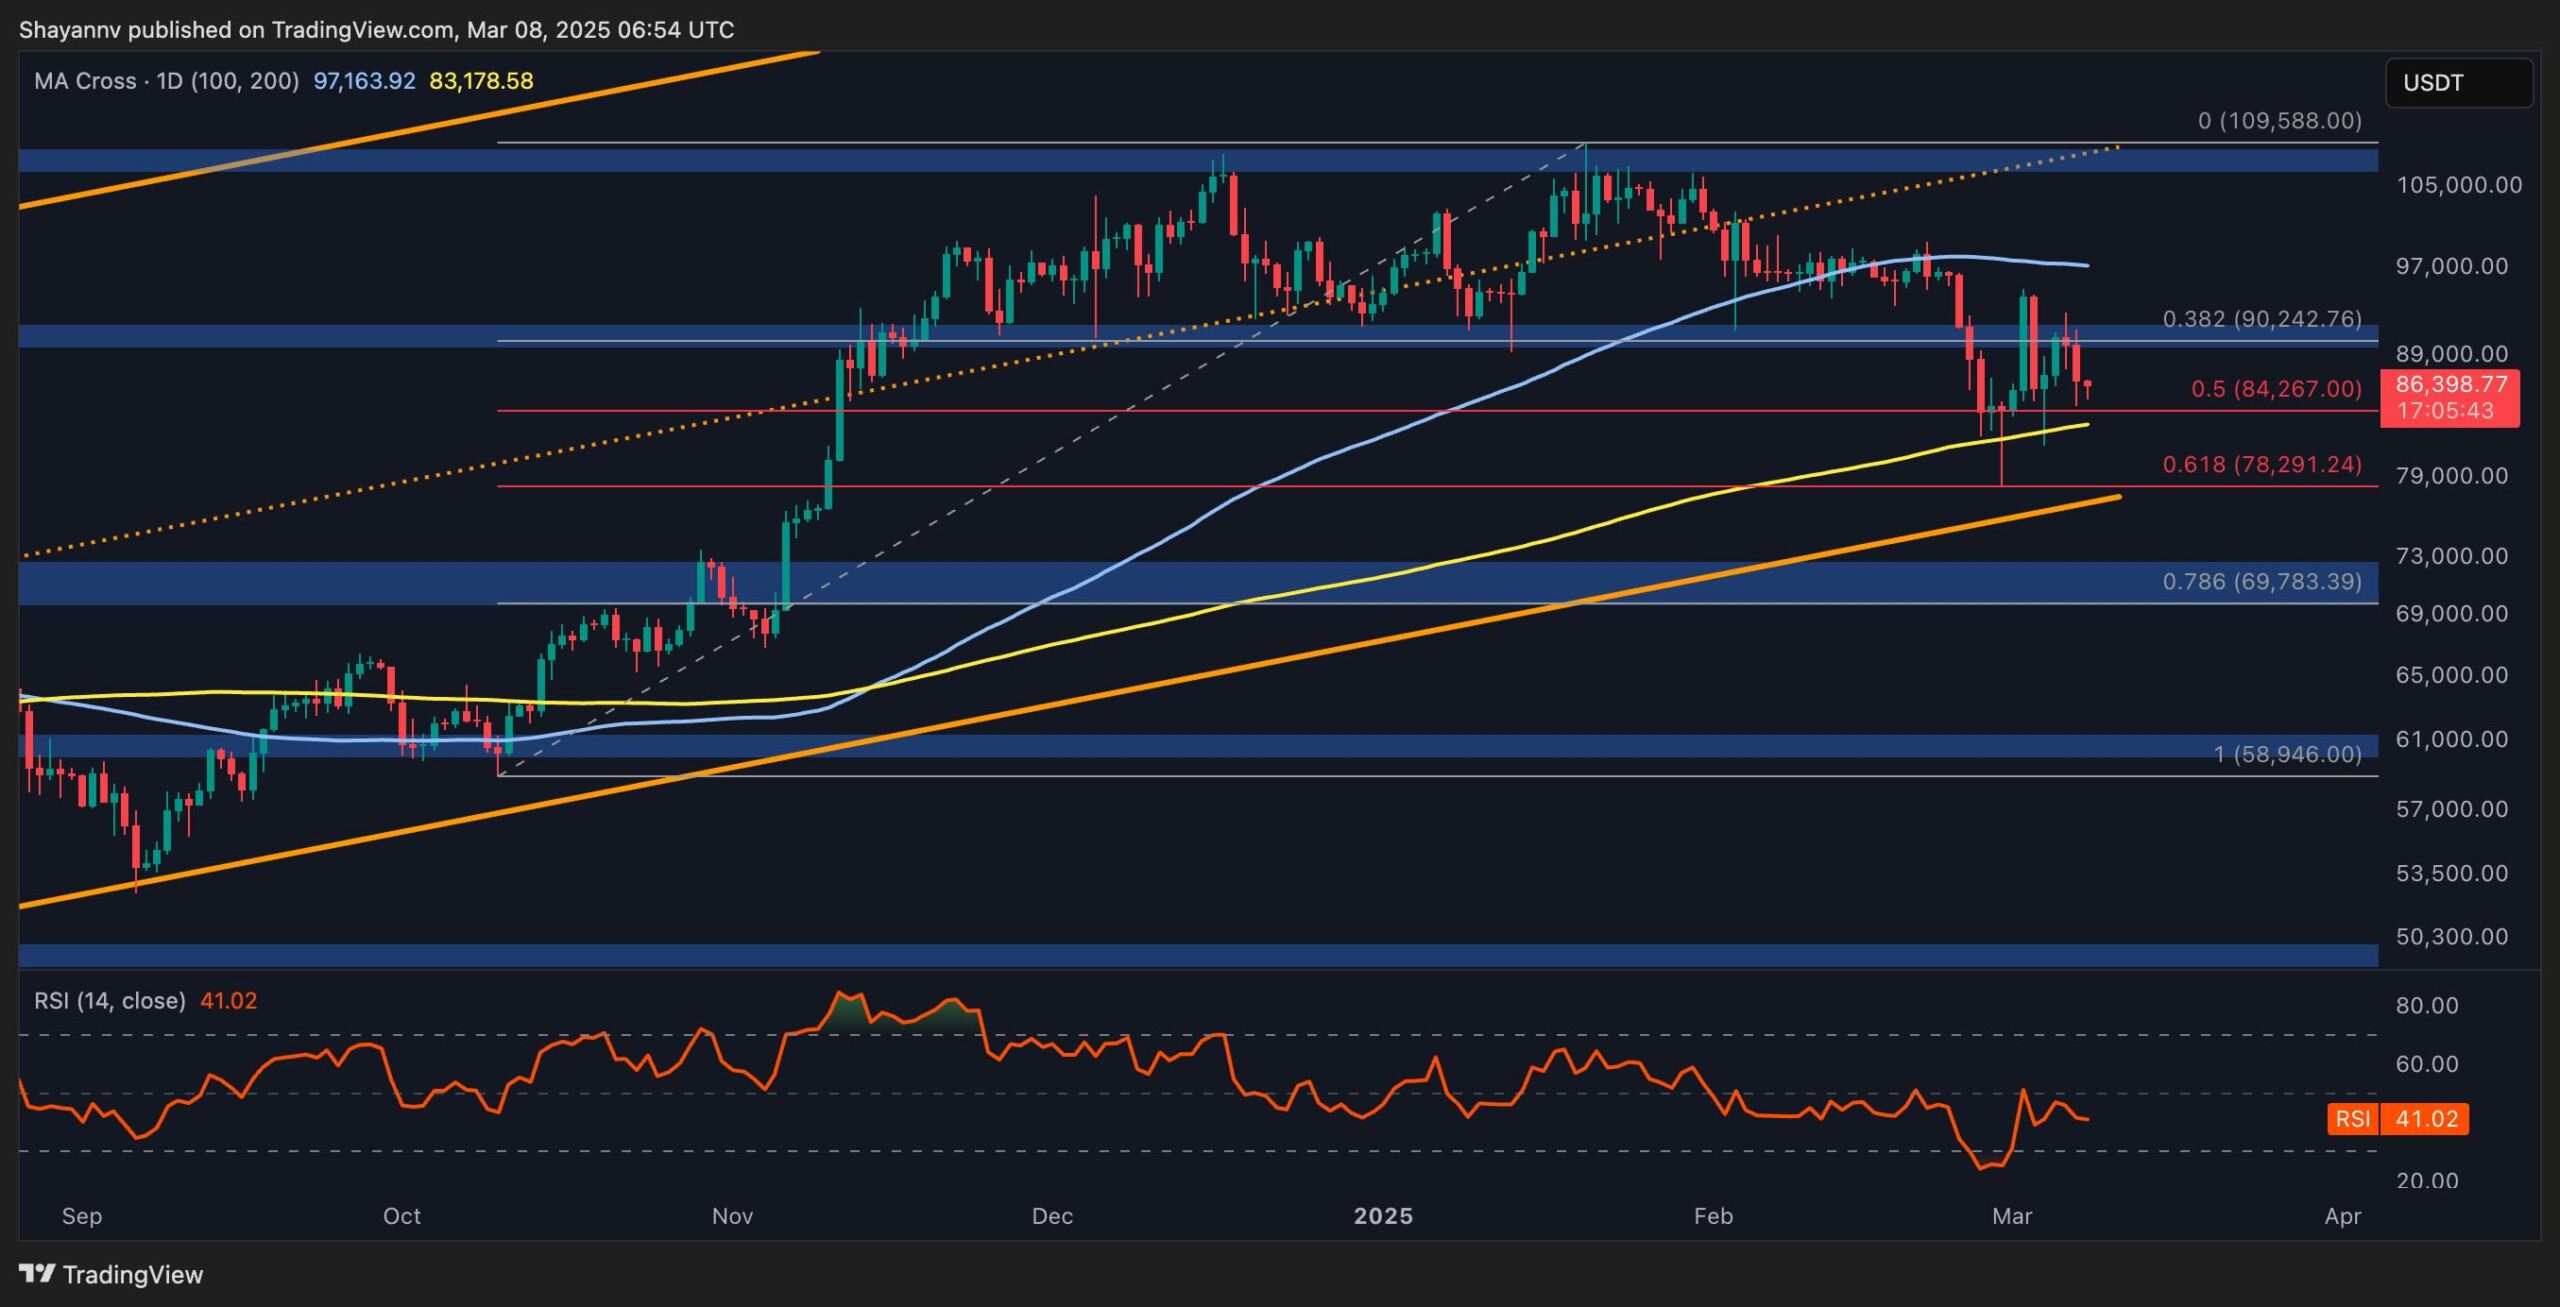
Bitcoin is currently testing a crucial support zone at the 200-day moving average ($83K) and the 0.5 Fibonacci retracement level. The price action near this range is critical and decisive for the market, as a bearish breakdown could trigger a major sell-off.
Technical Analysis
By Shayan
The Daily Chart
Bitcoin’s price has found support at the 200-day MA ($83K), leading to a sideways consolidation. This support zone aligns with the 0.5-0.618 Fibonacci retracement range, reinforcing its importance. A break below this level could signal a trend shift toward a bearish market, while holding above it may initiate a bullish rebound.
For now, Bitcoin is trapped between the 100-day ($95K) and 200-day MAs ($83K). Until a decisive breakout occurs, consolidation within this range is the most probable scenario for the short term.
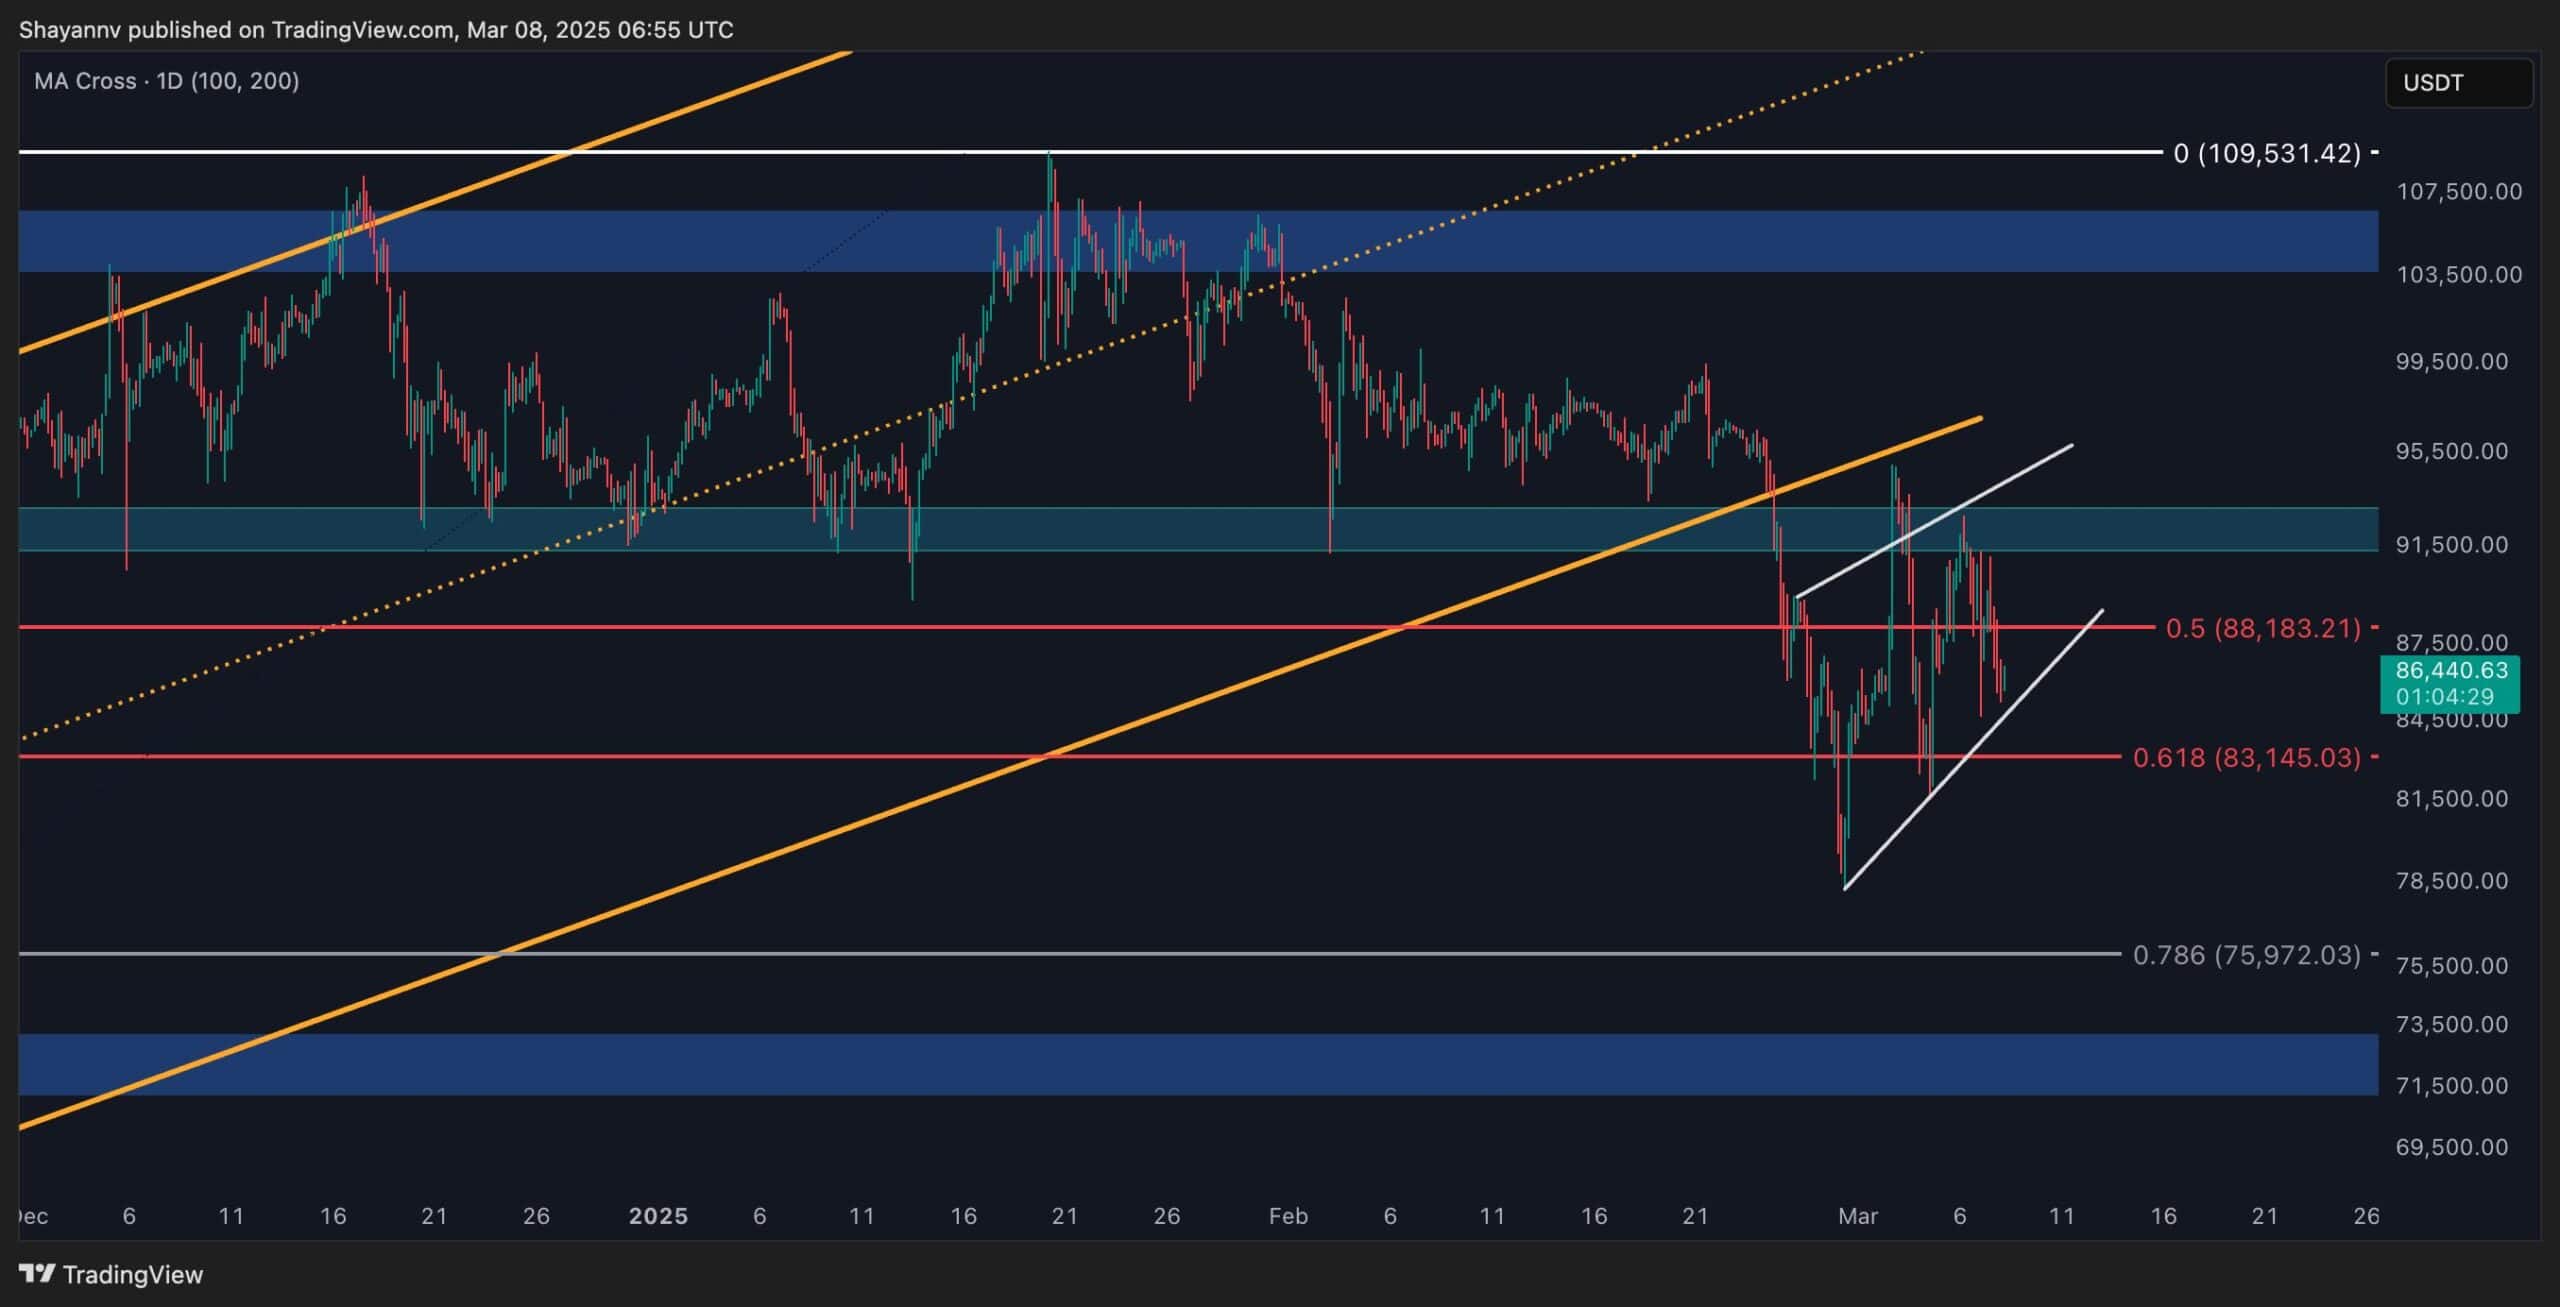
The 4-Hour Chart
On the lower timeframe, Bitcoin broke below its ascending channel, followed by a retracement to the broken support, a classic bearish confirmation.
This pattern suggests further downside risk if the cryptocurrency breaks below the wedge’s lower boundary, potentially pushing the price below $80K.
However, the 0.5-0.618 Fibonacci range remains a strong support zone, increasing the likelihood of a mid-term bullish reversal. Given the uncertain price action, Bitcoin is expected to consolidate between $80K-$95K in the short term until a breakout determines the next major trend.
On-chain Analysis
By Shayan
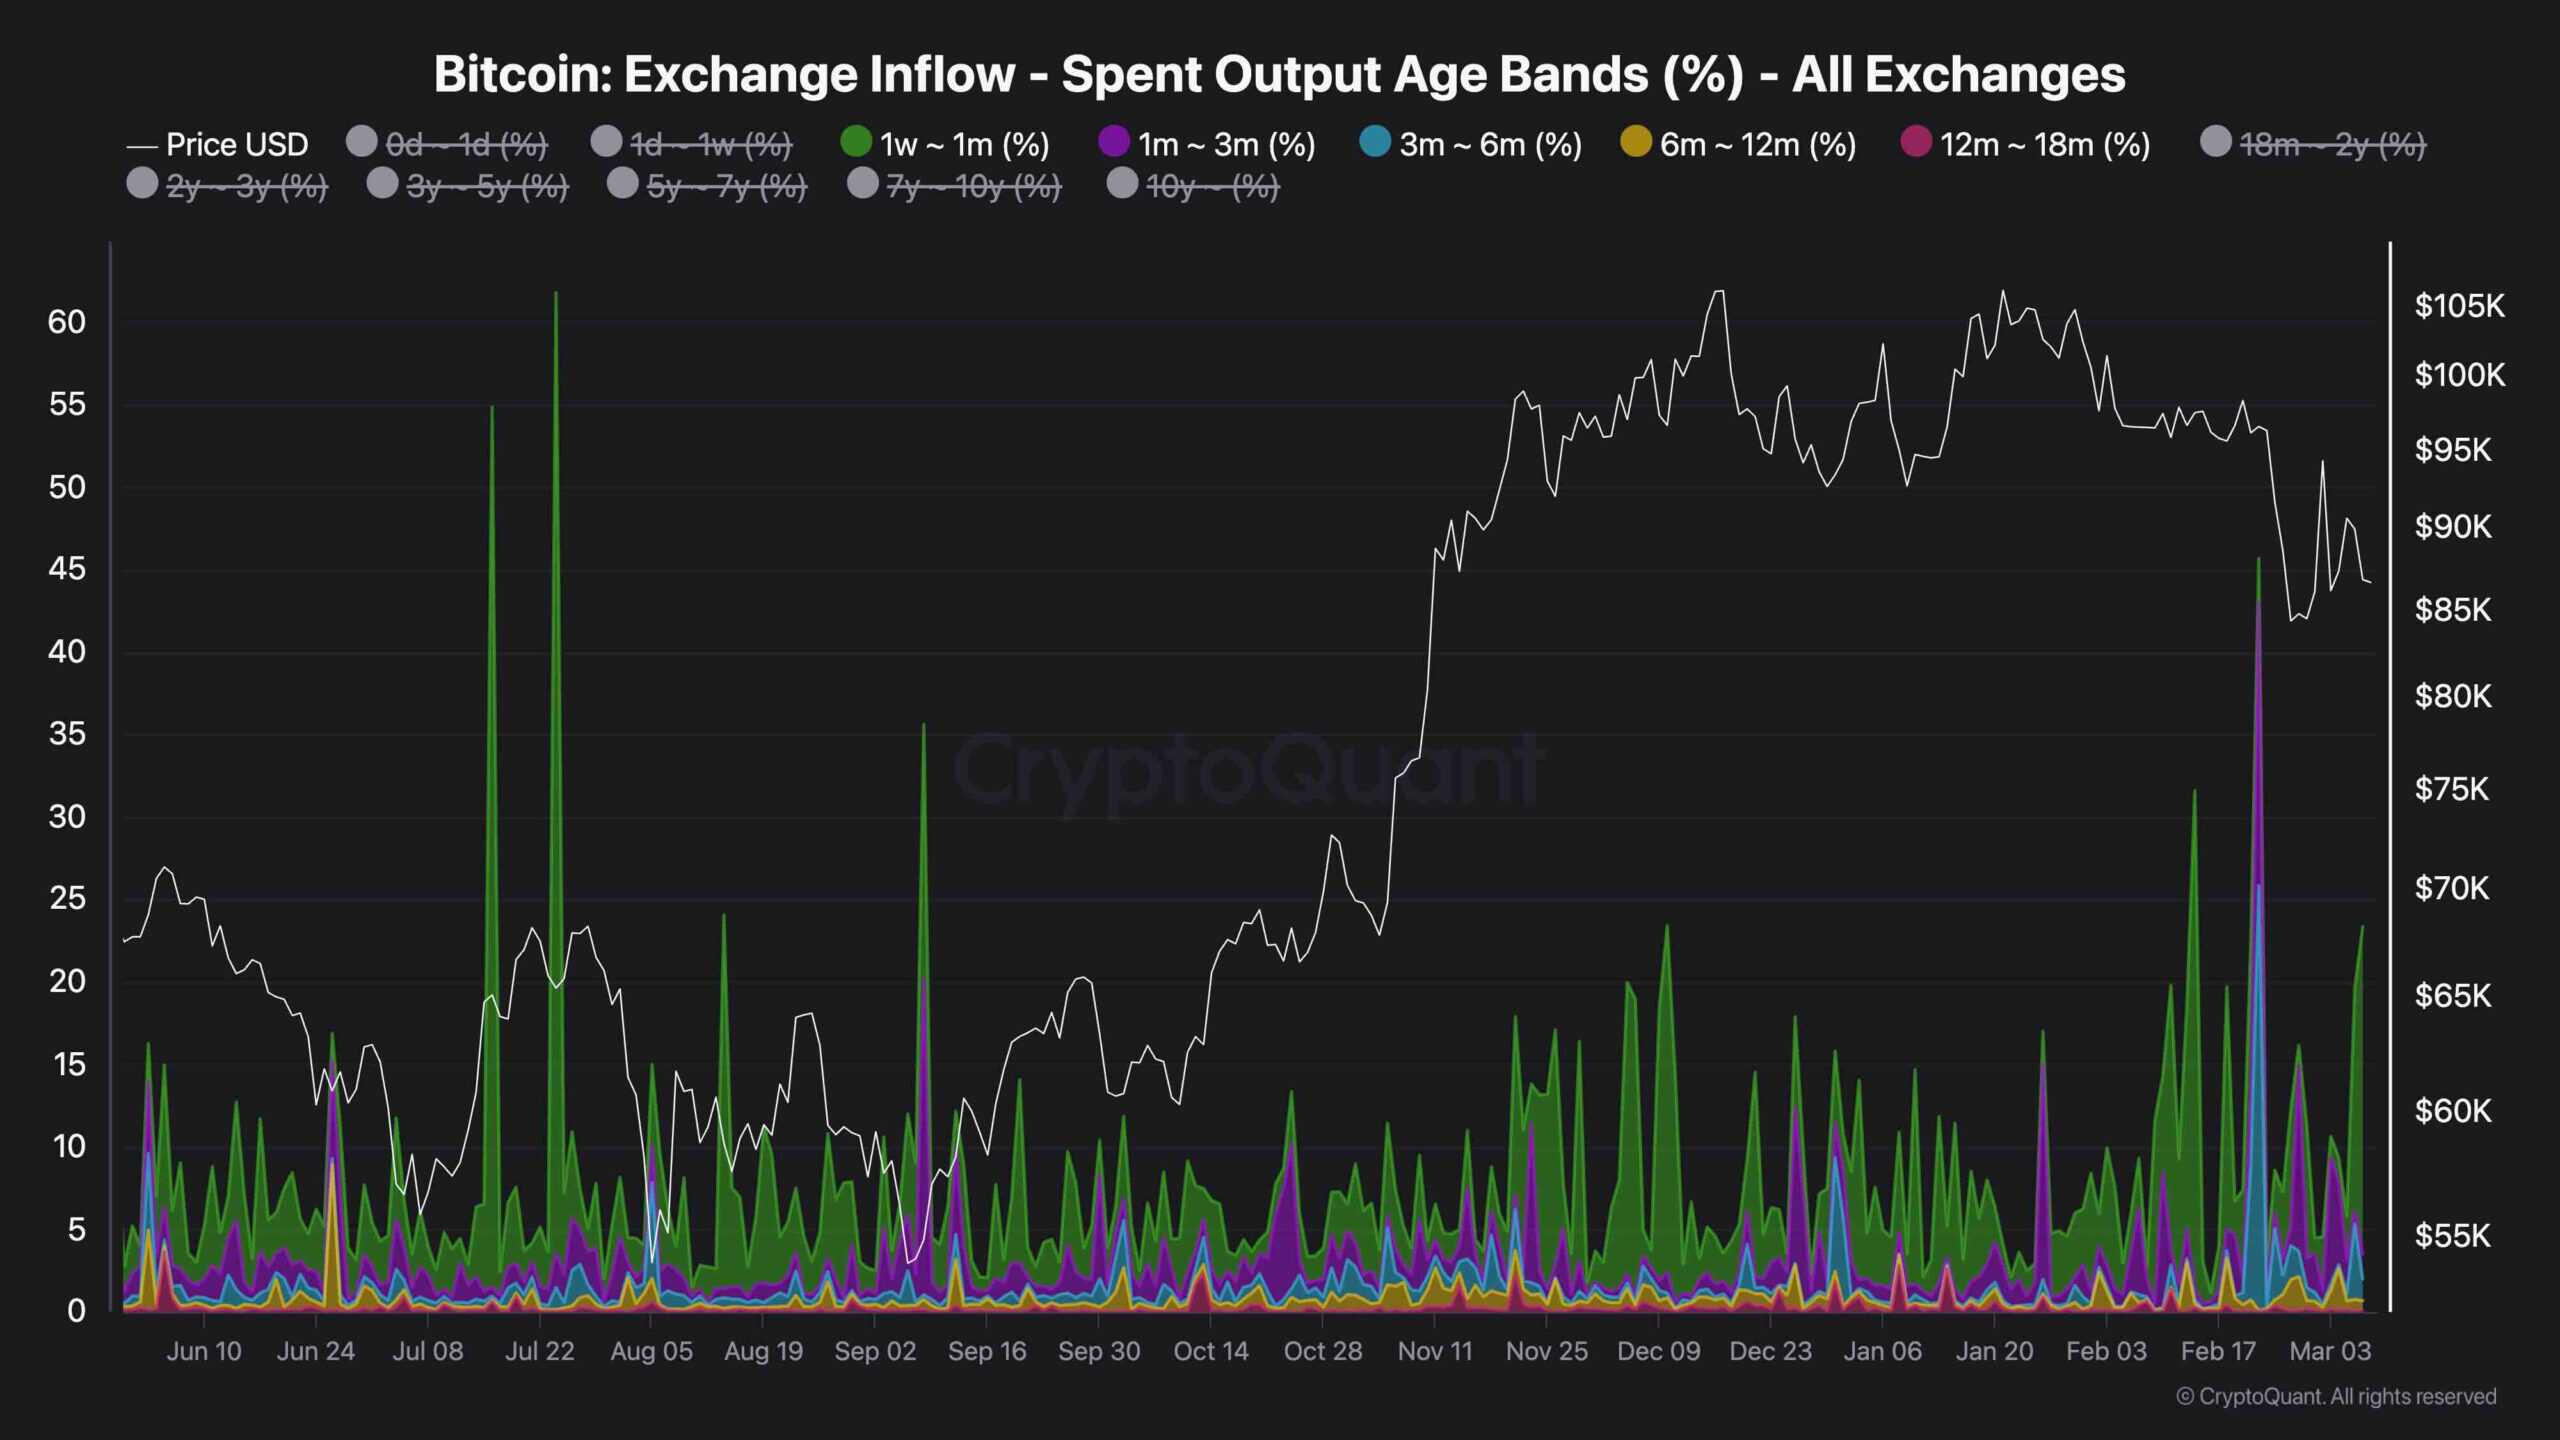
While Bitcoin’s bullish momentum appears to be fading, analyzing investor behavior provides key insights into market sentiment. One valuable metric in this regard is the Spent Output Age Bands of exchange inflows, which measures the proportion of deposited BTC based on how long investors have held their coins.
Examining the 1-week to 6-month age band, recent sell-offs have been primarily driven by short-term holders, investors who typically react quickly to price swings. This suggests that panic selling and profit-taking among these traders have contributed to the price retracement.
On the other hand, long-term investors (holding for over 6 months) show no signs of aggressive selling pressure. Instead, their activity aligns with gradual profit-taking, a characteristic of any healthy bullish trend.
This implies that these investors expect higher prices before distributing, reducing immediate supply in the market. If sufficient demand enters the market, this supply shrinkage could fuel further price appreciation.
The post Bitcoin Price Analysis: Is BTC Due for an Imminent Crash to $80K This Week? appeared first on CryptoPotato.