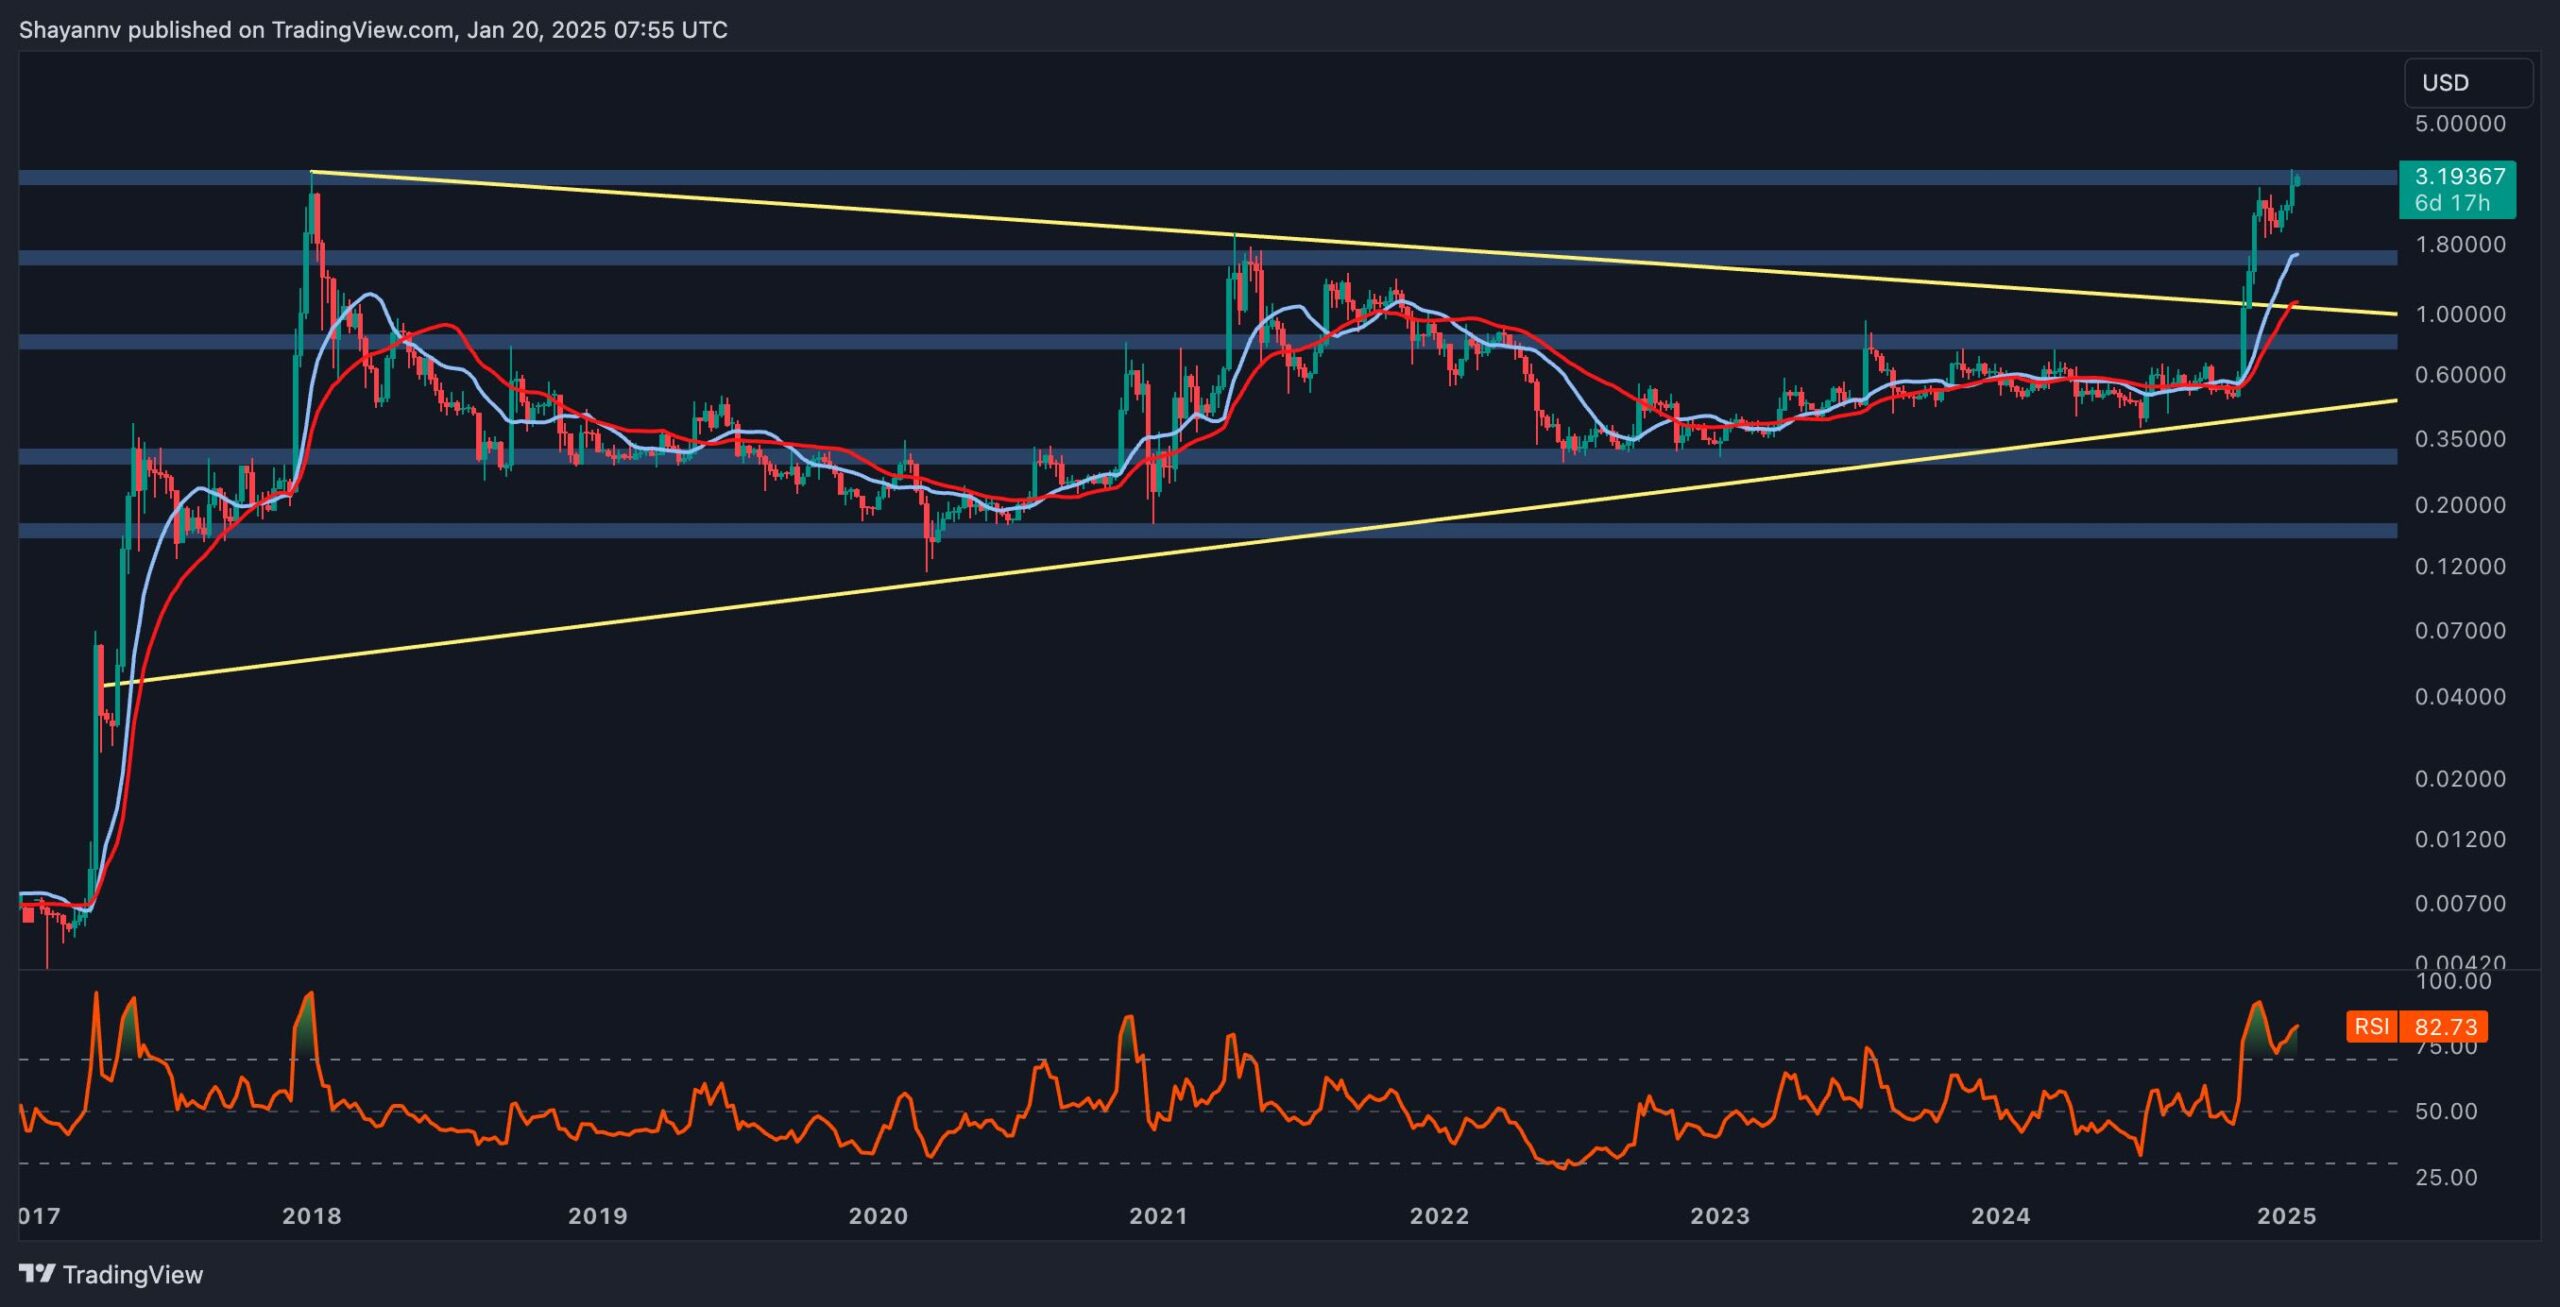
Ripple has experienced a decisive breakout from a multi-year sideways wedge pattern, marking a significant bullish trend and reaching its all-time high.
This surge underscores buyers’ dominance in the market, with the potential for further upward momentum.
XRP Analysis
By Shayan
The Weekly Chart
During the weekly timeframe, XRP demonstrated substantial strength by breaking above a key resistance zone, including the multi-year wedge’s upper boundary and the prior major swing high of $2. This bullish breakout was fueled by the 100-day and 200-day moving averages at $0.6, highlighting strong buyer activity.
The asset has now reached its ATH at $3.4, with the RSI indicator signaling an overbought state. While a temporary correction or consolidation may be anticipated, the ongoing buying pressure suggests the possibility of continuing the uptrend toward new ATHs.
The 4-Hour Chart
On the 4-hour timeframe, Ripple’s bullish structure is evident. After breaking above a short-term sideways wedge pattern at $2.5, the asset surged optimistically, nearing its ATH. However, the price encounters resistance near the $3.3-$3.4 region, a zone with significant supply.
While a temporary rejection and market consolidation may occur, the strong bullish momentum suggests a potential breakout above this resistance, possibly setting new ATHs. Nevertheless, heightened volatility should be anticipated in the near term.
Binance Free $600 (CryptoPotato Exclusive): Use this link to register a new account and receive $600 exclusive welcome offer on Binance (full details).
LIMITED OFFER for CryptoPotato readers at Bybit: Use this link to register and open a $500 FREE position on any coin!
Disclaimer: Information found on CryptoPotato is those of writers quoted. It does not represent the opinions of CryptoPotato on whether to buy, sell, or hold any investments. You are advised to conduct your own research before making any investment decisions. Use provided information at your own risk. See Disclaimer for more information.
Cryptocurrency charts by TradingView.

