Ripple’s price has once again disappointed investors, as the market crashed just when it began a seemingly new bull run.
XRP Price Analysis
By Edris Derakhshi (TradingRage)
The USDT Paired Chart
Against USDT, XRP has failed to stay above the $0.6 level, and it has also broken below the 200-day moving average following an unexpected crash.
The RSI also shows values below 50%, indicating that the market momentum is bearish.
If the price does not successfully climb back above the 200-day moving average, a further drop toward the $0.5 support level could be expected.
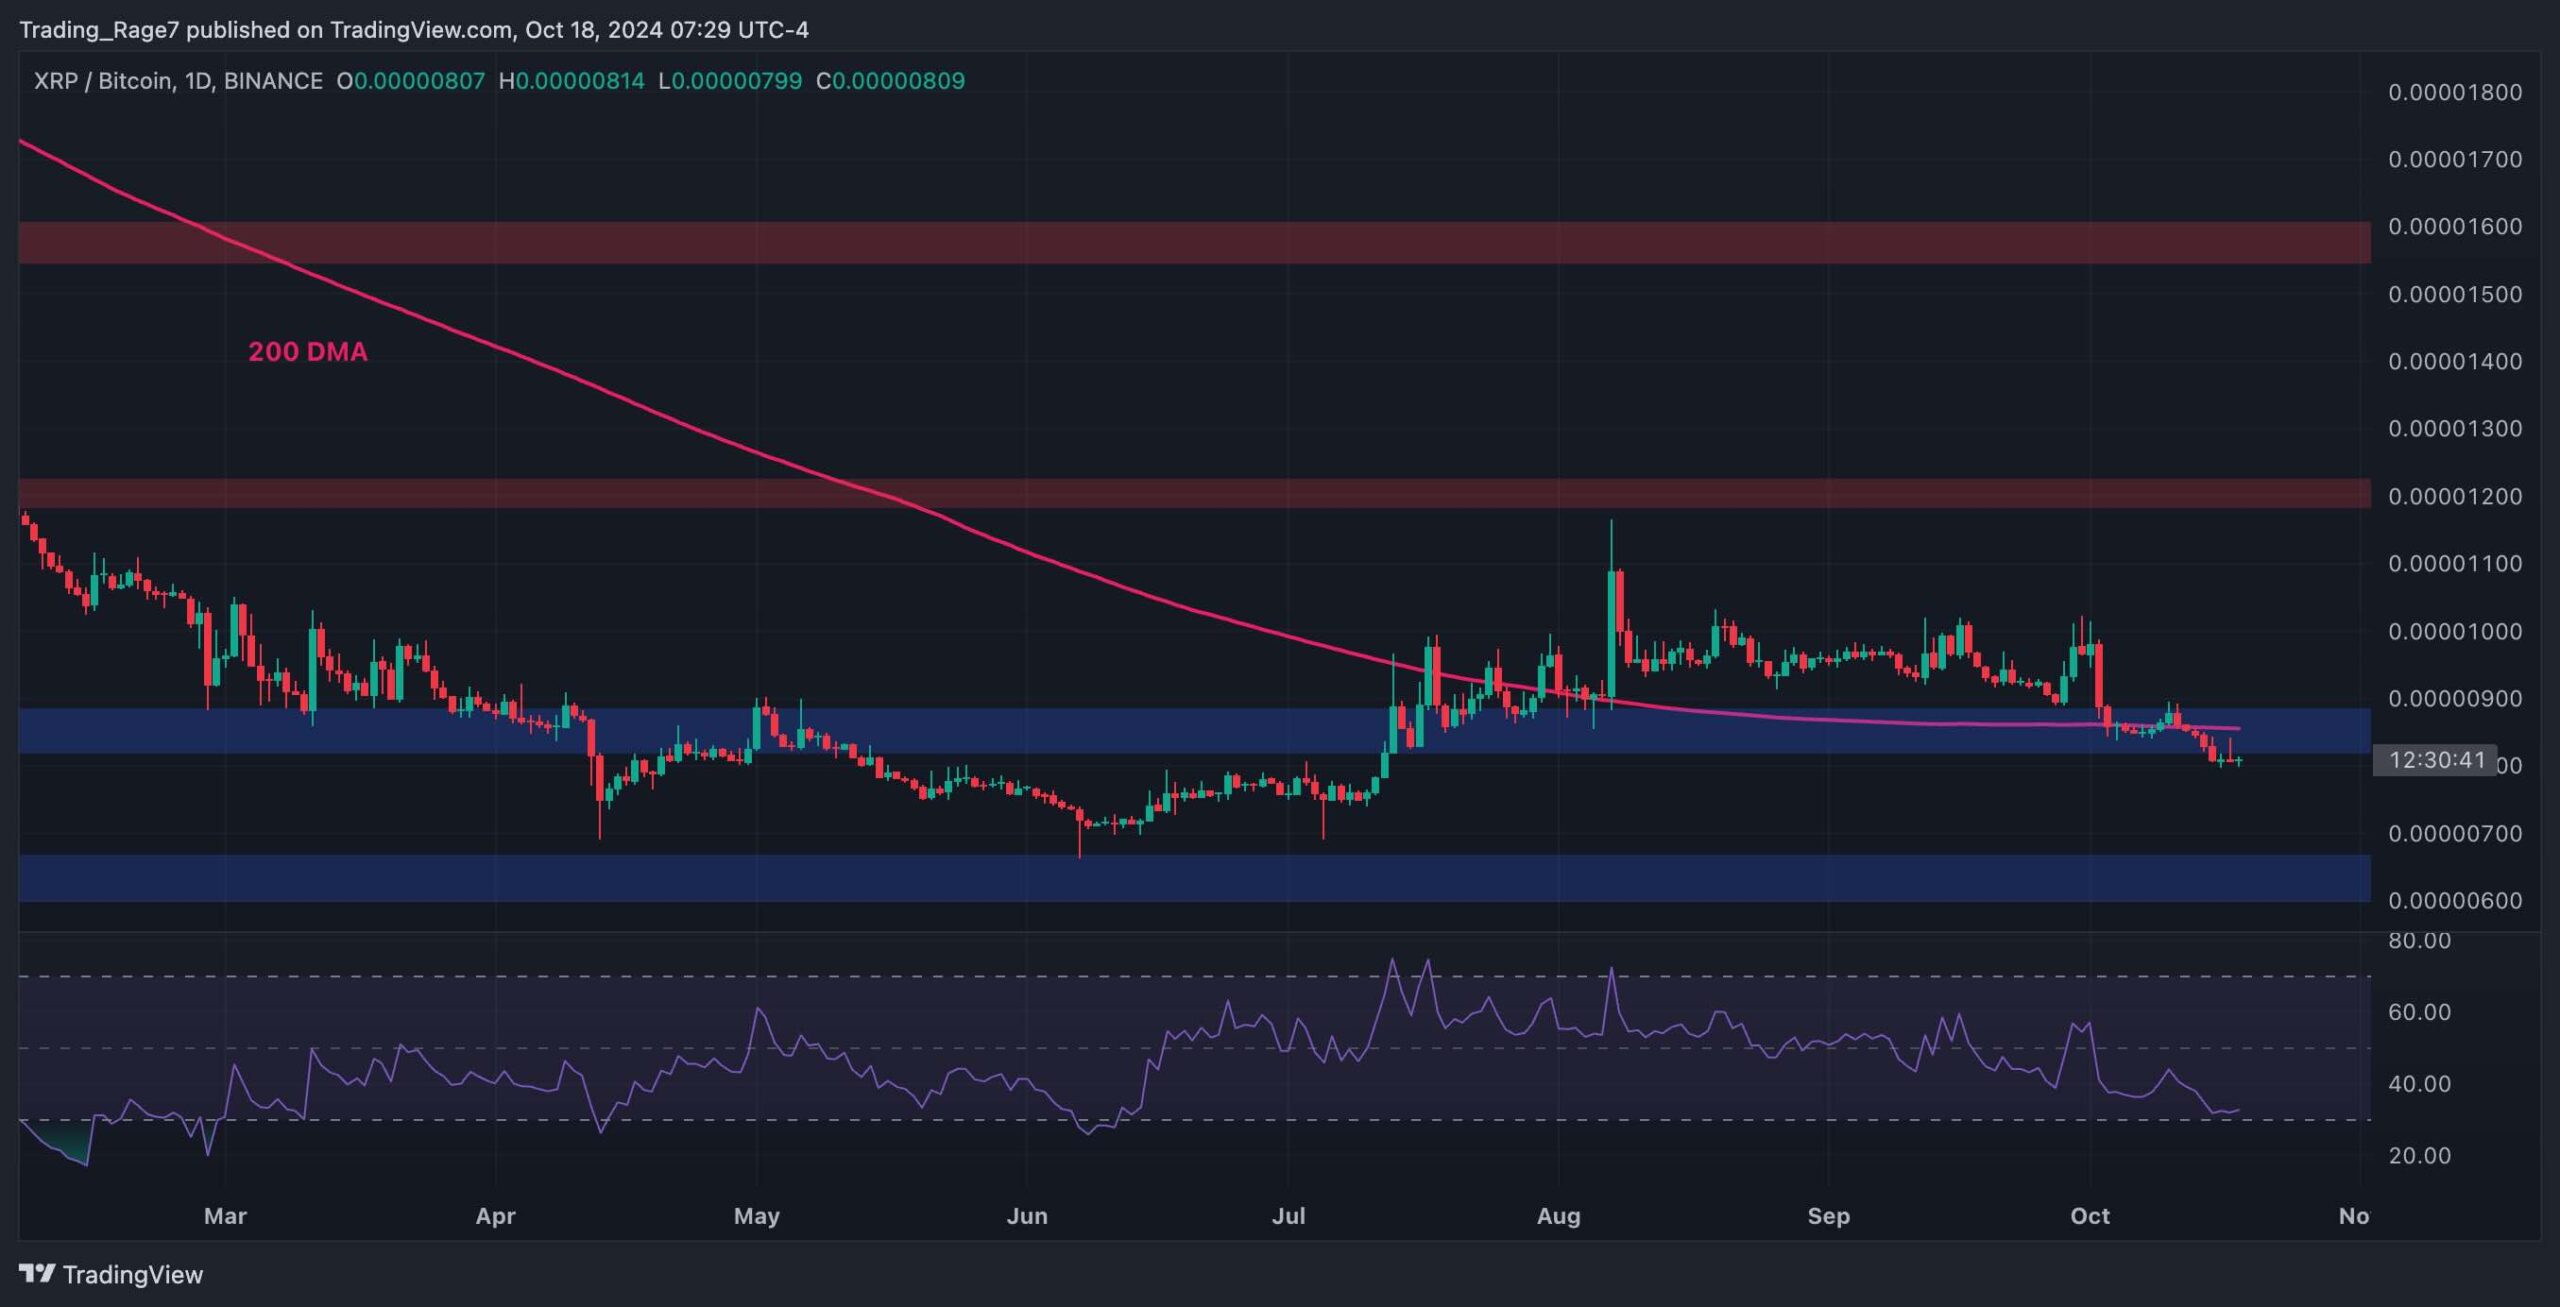
The BTC Paired Chart
Looking at the XRP/BTC pair, the market is demonstrating similar behavior.
The price has broken below the 200-day moving average and is also breaking through the 800 SAT support level. As it stands, a further decline toward the 600 SAT support zone seems more probable than any other bullish scenario.
This would change if the market breaks back above the 200-day moving, located around the 900 SAT mark.

Binance Free $600 (CryptoPotato Exclusive): Use this link to register a new account and receive $600 exclusive welcome offer on Binance (full details).
LIMITED OFFER 2024 at BYDFi Exchange: Up to $2,888 welcome reward, use this link to register and open a 100 USDT-M position for free!
Disclaimer: Information found on CryptoPotato is those of writers quoted. It does not represent the opinions of CryptoPotato on whether to buy, sell, or hold any investments. You are advised to conduct your own research before making any investment decisions. Use provided information at your own risk. See Disclaimer for more information.
Cryptocurrency charts by TradingView.